Reports
Access by clicking reports in the side bar.
What you can do
Search for all items that match a certain category, and where to find them.
View a snapshot of the warehouse categorised by location.
View a list of all trays ordered by their expiry date.
export a csv file containing all the trays in the warehouse.
Publish a report as a csv file, and keep it stored for future trend reporting.
See a percentage of all free trays in the warehouse to get an accurate representation of how full the warehouse is.

Overview
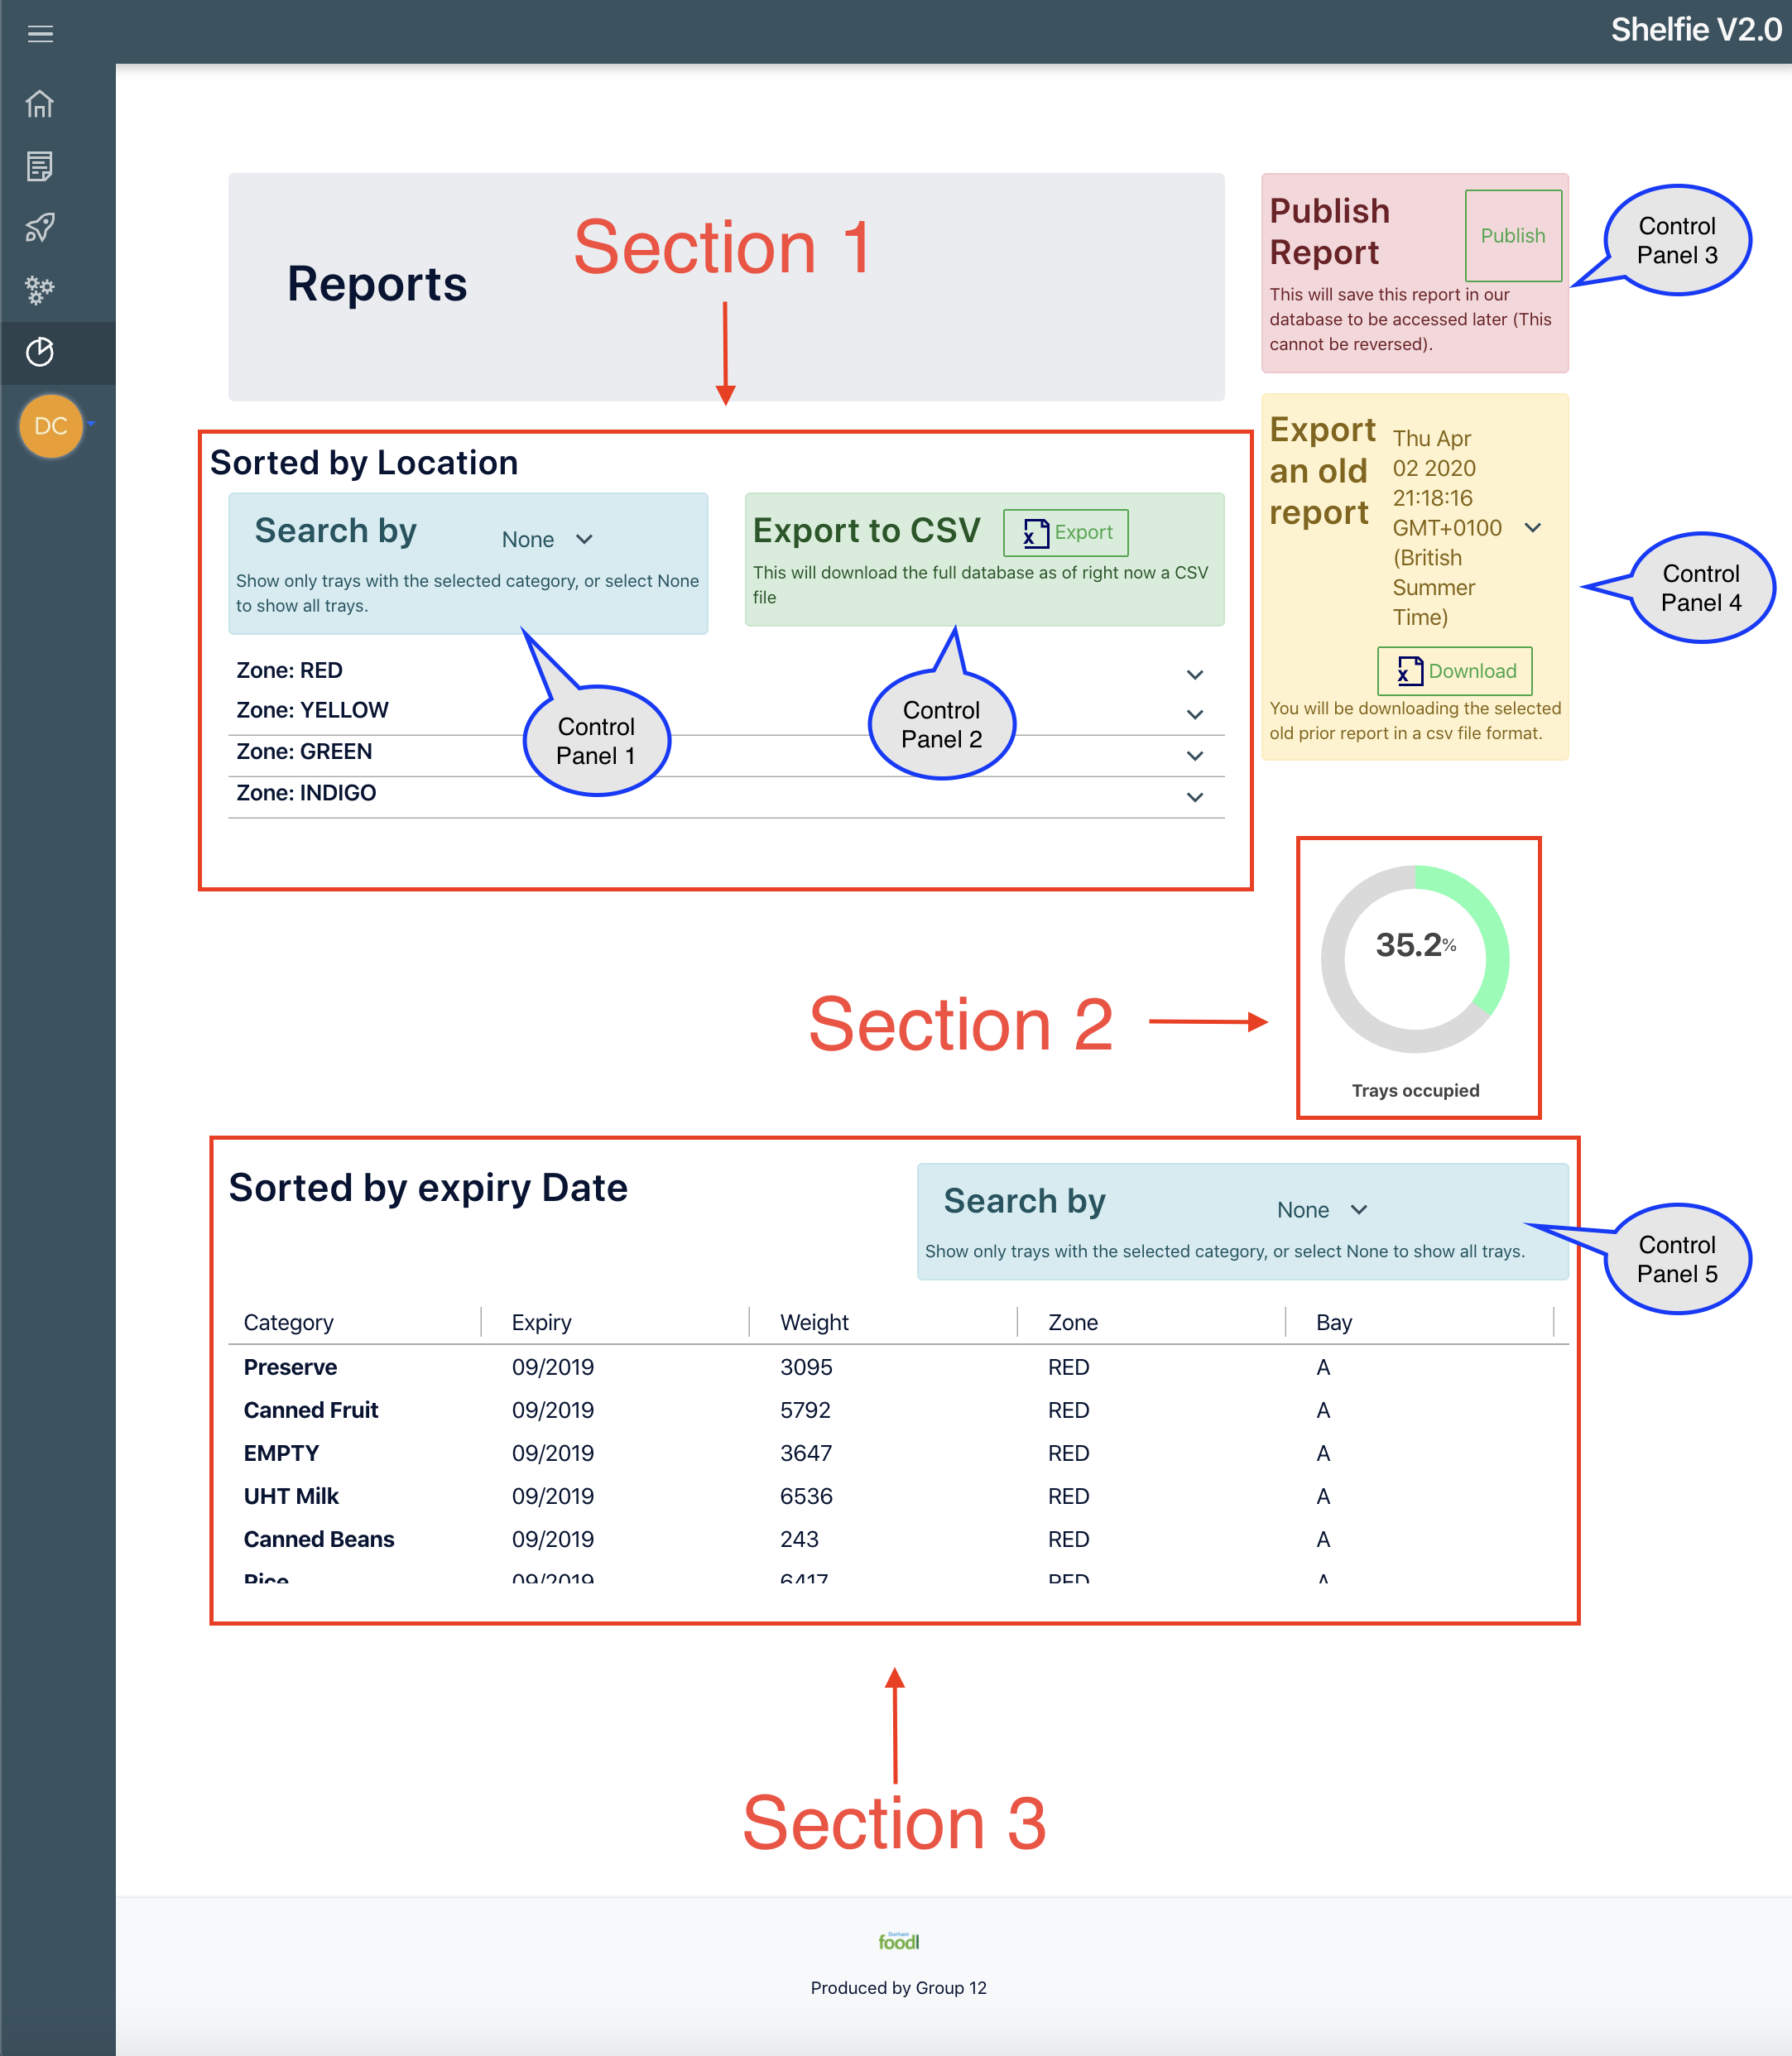
Section 1on the diagram shows you the snapshot of the warehouse.- you can filter this snapshot to only show trays that contain a desired category by choosing it from the drop down menu in
Control Panel 1
- you can filter this snapshot to only show trays that contain a desired category by choosing it from the drop down menu in
- You can export the full database of trays at this point in time into a CSV file and download it.
- You can do this by clicking
ExportinControl Panel 2.
- You can do this by clicking
- You can save the snapshot of the warehouse on the server for guaranteed future access, by clicking
PublishinControl Panel 3.- This cannot by reversed, so only publish if and when it is absolutely necessary to do so, e.g. on a weekly basis after stock is taken.
- You can download published reports in a csv format by selecting the report that was published from the dropdown list in
Control panel 4and clicking theDownloadbutton inControl Panel 4.
Navigating the warehouse
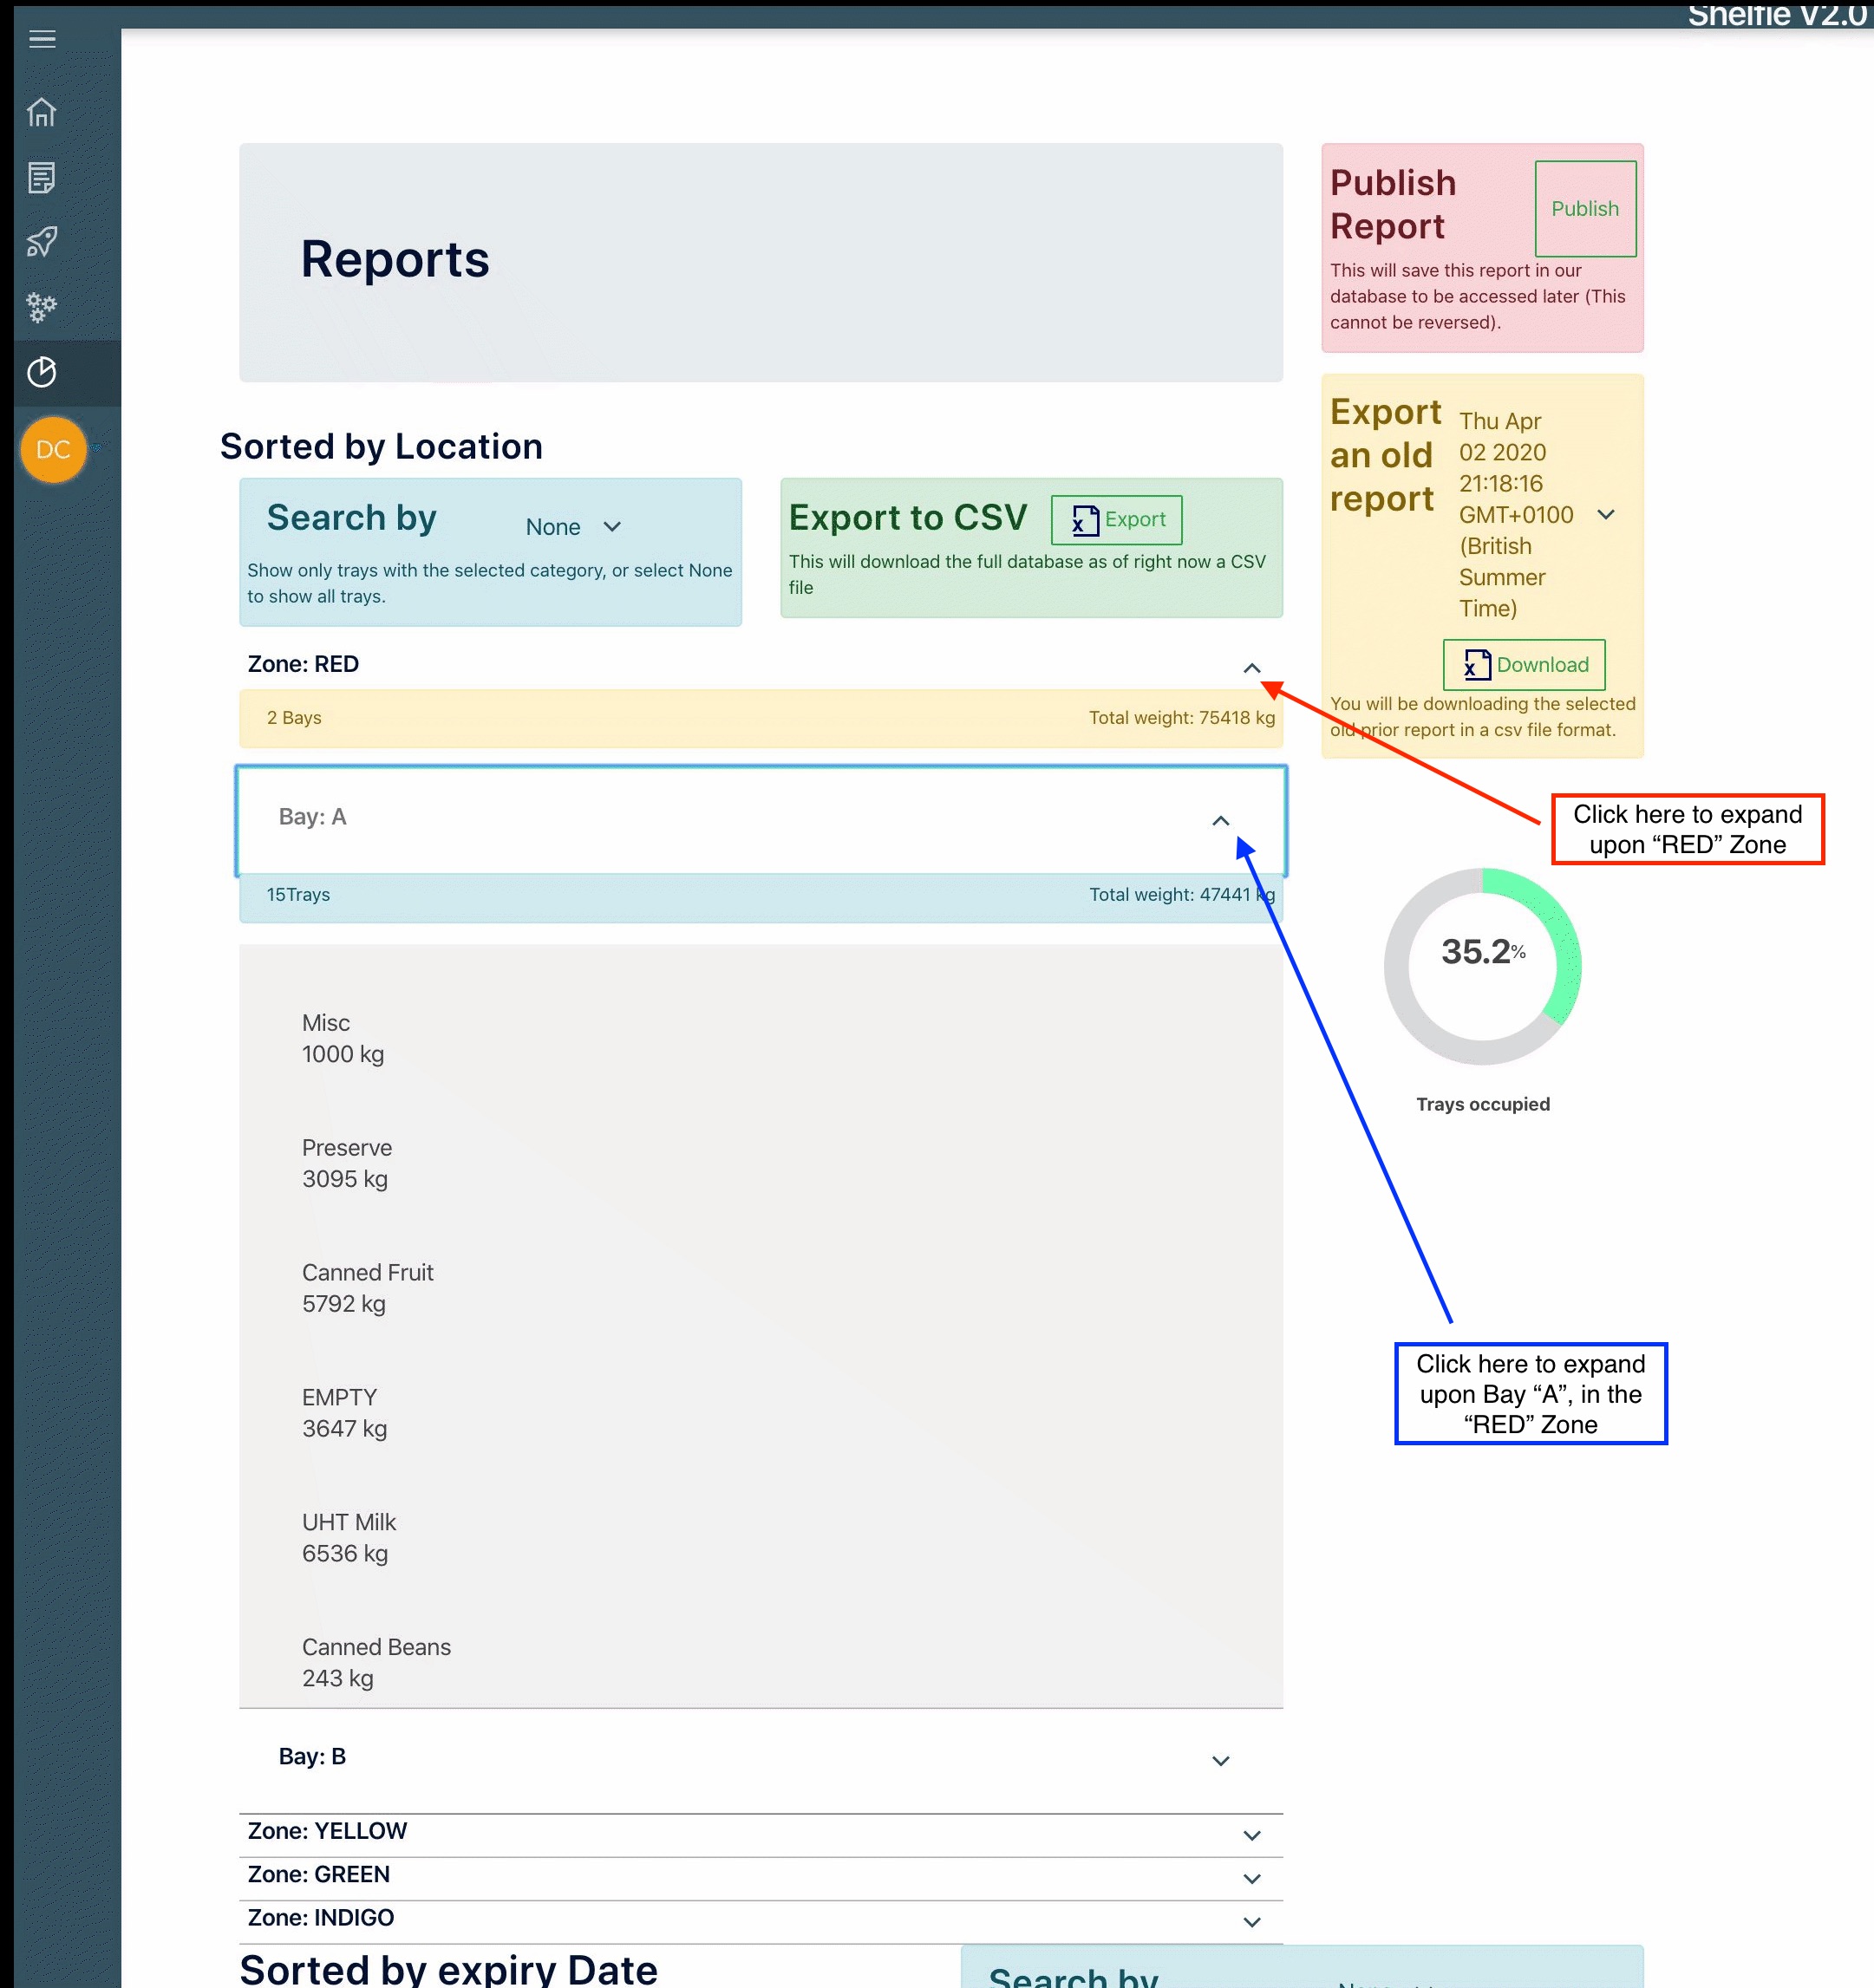
- Clicking on the target zone to expand.
- You will see the total weight of all products in the zone

- Followed by a list of bays that the zone contains, or the bays that contain a category to be searched for.
- Expanding on a bay will show you the full weight of trays in that bay, this can be useful to see if a bay is too heavily laden.
- Beneath is a list of all the trays that match the search criteria, (their weight, category and expiry).
- You will see the total weight of all products in the zone
 * Note: you will have to expand on each acordion manually to see the contents. This is meant to create a clean environment to view the data, if this is not suitable you can: 1. export to CSV, 2. Open the file in Microsoft Excel, and apply filters to each column and perform a search based on any criteria, sort by any field. A full feature list can be found here: [Help with Microsoft Excel Filters](https://support.office.com/en-gb/article/filter-data-in-a-range-or-table-01832226-31b5-4568-8806-38c37dcc180e)
Determine how full the warehouse is
- The progress wheel in
Section 2shows the percentage of the tray spaces in the warehouse that have been declared as empty on the most recent stock take.
View an ordered list of the next Expiring trays
In Section 3 of figure 1, you can see an ordered list of all the trays in the warehouse.
- You can filter the list by a chosen category in drop down menu within
Control Panel 5.
